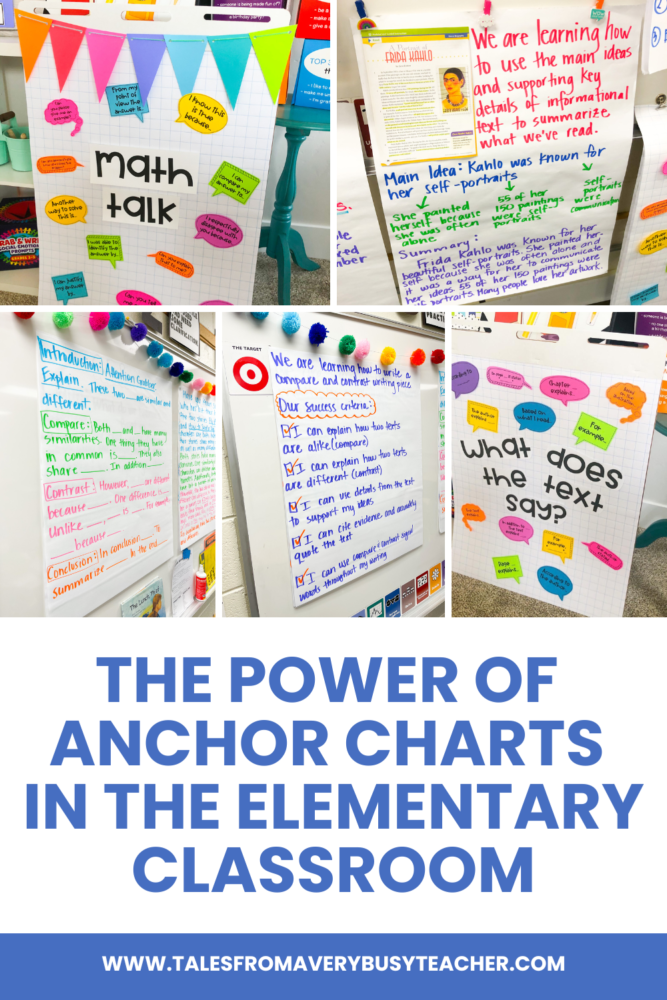

Anchor charts are a staple in many elementary classrooms, and for good reason. These visual tools not only help to document important learning goals and success criteria but also serve as interactive resources that students can refer to throughout their learning journey. In a world where students are constantly bombarded with information, anchor charts provide a consistent, clear, and accessible way to keep essential learning concepts front and center.
Documenting Learning Goals
One of the primary purposes of anchor charts is to document learning goals. When students know what they are expected to learn, they are more likely to stay focused and motivated. By clearly displaying learning goals on an anchor chart, you provide a constant reminder of what the class is working towards. This transparency helps students take ownership of their learning, as they can easily see what they need to accomplish.
For example, if your class is working on learning how to describe characters, you might create an anchor chart that outlines specific learning goals. These could include determining adjectives to visualize the character’s physical appearance, identifying details that reveal personality traits, and evaluating character development through actions and dialogue. As the unit progresses, you can add examples and student contributions to the chart, turning it into an evolving resource that supports students in mastering the art of character description.
Highlighting Success Criteria
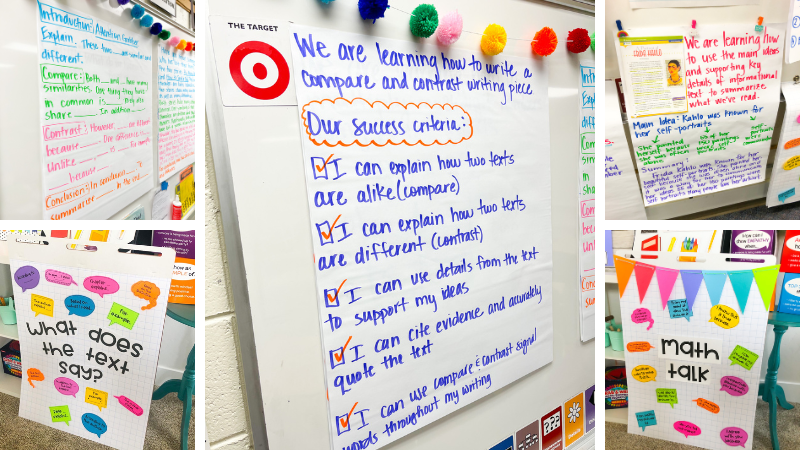
In addition to learning goals, anchor charts are an excellent way to highlight success criteria. Success criteria are the specific steps or standards that students need to meet to achieve the learning goals. By clearly outlining these criteria, you provide students with a roadmap to success.
For instance, in a math unit on multiplication, an anchor chart might list the steps for solving multi-digit multiplication problems. As students work through problems, they can refer to the chart to ensure they are following the correct process. This not only helps them stay on track but also builds their confidence as they see themselves meeting the success criteria.
Interactive Resources for Ongoing Learning
One of the most powerful aspects of anchor charts is their ability to serve as interactive resources. Unlike static posters or worksheets, anchor charts can be updated, modified, and referenced throughout the learning journey. This interactivity encourages students to engage with the material in a meaningful way.
For example, during a reading comprehension unit, you might create an anchor chart that tracks different types of questions (e.g., literal, inferential, evaluative) and examples of each. As students read new texts, they can add questions to the chart or use it to help them formulate their own questions. This ongoing interaction with the anchor chart reinforces the learning and makes it more dynamic.
Additionally, anchor charts can be used to document students’ thinking and ideas. If you’re teaching a science unit on ecosystems, you might start with a basic chart that outlines the components of an ecosystem. As students learn more, they can add their observations, questions, and findings to the chart. This not only makes the learning visible but also fosters a sense of collaboration and shared inquiry.
Making Learning Visible and Accessible
One of the key benefits of anchor charts is that they make learning visible and accessible to all students. Whether a student needs a quick reminder of a concept or a deeper dive into the success criteria, the anchor chart is there to provide support. This is especially valuable for visual learners, who benefit from seeing information presented in a clear and organized way.
Tips for Effective Anchor Charts
To maximize the effectiveness of your anchor charts, consider the following tips:
- Keep It Simple: Focus on one key concept per chart to avoid overwhelming students with too much information.
- Use Student-Friendly Language: Write in a way that your students can easily understand and relate to.
- Incorporate Visuals: Use images, icons, and color-coding to make the chart more engaging and easier to interpret.
- Involve Students: Let students contribute to the creation of the chart, whether by adding their own ideas, examples, or illustrations.
- Update Regularly: As learning progresses, add to or modify the chart to reflect new knowledge and understanding.
- Display Prominently: Place the anchor chart where students can easily see and access it, ensuring it becomes a central part of your classroom environment.
Anchor charts are more than just classroom decorations—they are essential tools for documenting learning goals, highlighting success criteria, and providing interactive resources that support students throughout their educational journey. By integrating anchor charts into your teaching practice, you empower students to take ownership of their learning, make connections between concepts, and achieve success. Whether you’re introducing a new topic, reinforcing a key skill, or reflecting on learning, anchor charts can help you and your students navigate the path to mastery.
For more teaching ideas, don’t forget to subscribe.